How to Draw a Cross-Section of a Map
Step 1
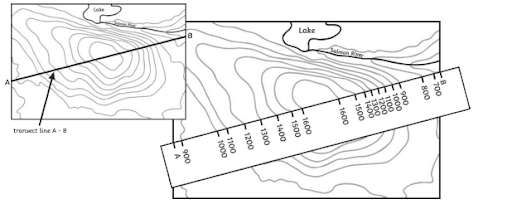
Take a thin strip of paper and place it along the transect line on the map. Mark A at the start of the transect and B at the end. Where each contour line crosses the strip of paper, make a mark on the paper at the exact point and record the height. Also mark on any roads or rivers etc.
Step 2
On a piece of graph paper, draw the horizontal axis of your graph exactly the same length as the transect A-B. Remember to use a ruler and pencil!
Step 3
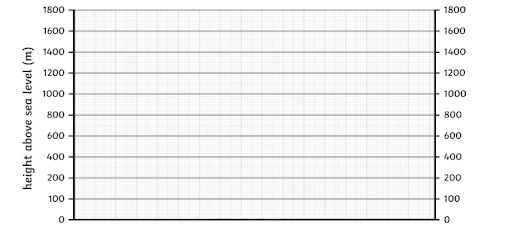
Draw two vertical axes using a suitable scale. Check the maximum height of your axes by looking at the heights along the transect. In this example, the axes need to be at least 1600m high as this is the highest point on the map. Label your axes.
Step 4
Place the strip of paper along the x-axis at the bottom of your graph. Line A and B up with the vertical axes.
Step 5
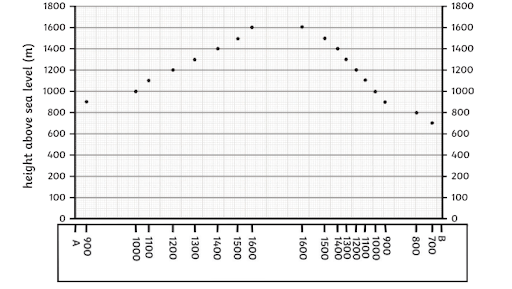
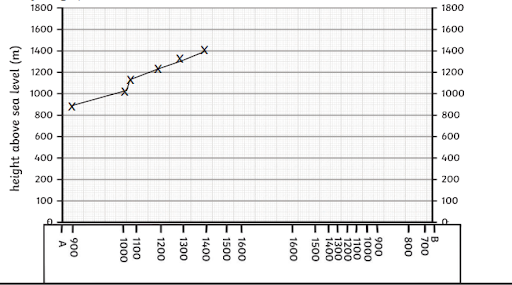
Plot the heights marked on the piece of paper onto the graph. You can move the paper up the graph but make sure the A is always lined up with the vertical axis!
Step 6
Using a pencil, draw a smooth line to connect the dots. This will give you a rough estimation of what the landscape is like.
Step 7
Add a title to your graph.
Cross- Section of Mt.Ain
A profile across a subduction zone
Introduction
During the Ordovician, Ireland was at the edge of a converging tectonic plate, where subduction was taking place. Today, we see something similar in the Andes.
Aim of practical
Your task in this practical is to draw profiles (in a cross section) across the Andes, from – 75°E -20°S to -65°E -15°S which illustrate the shape of the crust, and the position of the subducting slab. You will then identify certain key regions in the zone and label them.
Method
If you are not familiar with how to draw a cross section from a topographic map, the link that I have given you on Blackboard gives very clear instructions (I don’t need to re-invent the wheel here!). The only thing to note is that for our exercise we are working with depths, not heights, so the numbers increase downwards (I’ve already put them in in Figure 1 for you)
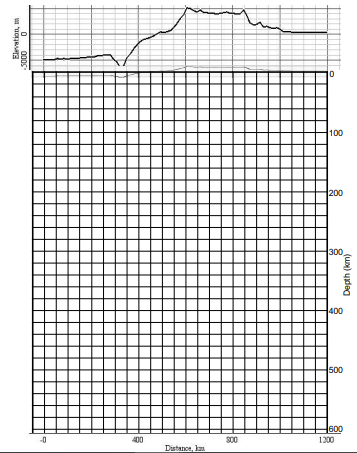
1.A bathymetric and topographic profile is already done for you showing the depth to the sea floor and the elevation of the land along the cross section line (Figure 1; marked with X – X’ on Map 1 – you will need to mark the points on Map 2).
2.Use the information in Map 1 to draw the depth to the top of the downgoing slab in your cross section.
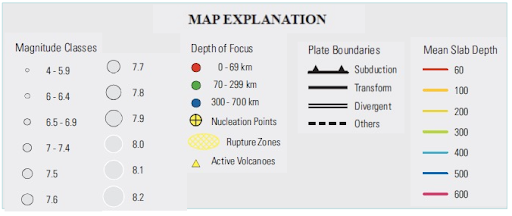
Map 1 shows the seismic (earthquake) activity in the region – the dots mark earthquake foci (where the earthquake rupture starts) and are colour coded to indicate how deep the focus was. Note that as you move away from the trench, the earthquakes get deeper – so we know that the oceanic plate is going underneath the continental plate (as we’d expect, given the density contrast).
The coloured lines are contour lines for the top of the downgoing slab. You use them to draw this part of your profile.
3.Assume that the slab is 70km thick (and this is perpendicular to the surface) draw in the bottom surface of the slab. This is very approximate, don’t agonise about it!
4.The information in Map 2 shows the depth to the Moho – i.e. the base of the crust – in the over-riding plate. Using the same method as before, transfer this information to your cross-section. Your line will pass close to but not cross some of the contours (the 40km and 70km) – you can extrapolate a little here and mark them on your profile .
5.Some of your lines will be left finishing in ‘mid-Earth’ (rather than mid-air) on your profile – so now you need to use your geological knowledge to tidy up the section. Think about what the lines mean – e.g. there has to be an edge to the over-riding plate; the oceanic plate has a base too (and we have the top because we have the sea floor)
6.Have a look at the questions on the final page to see if you can mark various points/regions on the cross section.
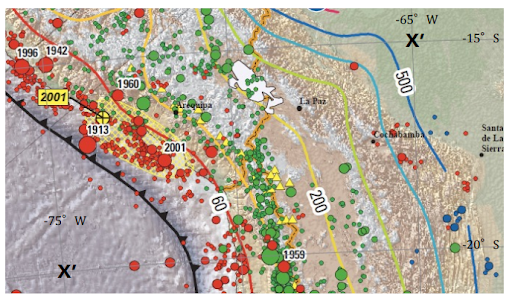
Map 1: Seismic and volcanic activity, and slab depth in a region of the Andes
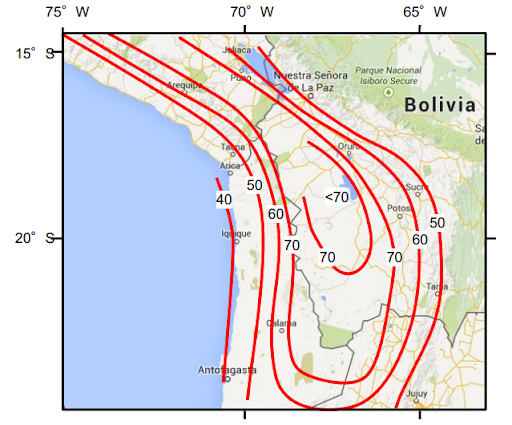
Map 2: Depth (in km) of the Moho (base of crust) in the Andes
Figure 1: Bathymetric and topographic profile from -75E -20S (0km) to -65E -15S (1200km)
Note the different vertical scale for the subsurface features, because, if the same scale was used as for the bathymetry and topography, there would either not be enough space on the page to do the full profile, or the topography would be negligible. I’ve duplicated (faintly)the bathymetry/topography at the subsurface scale to give you an idea of how minor it is. Note also that 0m elevation/ 0km depth is marked twice.
-
Business Economics Assignment 3: Case Study Analysis on Price Controls in Pharma and Monopoly Power in Airline Industry Business Economics Assignment 3: Case Study Analysis on Price Controls in Pharma and Monopoly Power in Airline Industry
Read More -
CSC408 MIS Case Study Assignment Report: Analysis of Issues and Solutions in Information Systems CSC408 MIS Case Study Assignment Report: Analysis of Issues and Solutions in Information Systems
Read More -
Scientific Research Review Assignment 4: Advancements and Ethical Practices in Your Study Area Literature Synthesis Scientific Research Review Assignment 4: Advancements and Ethical Practices in Your Study Area Literature Synthesis
Read More -
Organizational Development Assignment: Tech Solutions Inc. Case Study on Engagement, Retention, and Inclusive Culture Organizational Development Assignment: Tech Solutions Inc. Case Study on Engagement, Retention, and Inclusive Culture
Read More -
HPGD3103 Instructional Technology Assignment: ASSURE Model-Based Lesson Design in Google Classroom HPGD3103 Instructional Technology Assignment: ASSURE Model-Based Lesson Design in Google Classroom
Read More -
AI Deepfake Cybersecurity Assignment: Evaluating Security Risks and Detection Techniques for Safe Digital Environments AI Deepfake Cybersecurity Assignment: Evaluating Security Risks and Detection Techniques for Safe Digital Environments
Read More -
MGT4216E Strategic Innovation Management Assignment: Exploring Innovation Capabilities, Strategy Stages, and Leadership for Business Transformation MGT4216E Strategic Innovation Management Assignment: Exploring Innovation Capabilities, Strategy Stages, and Leadership for Business Transformation
Read More -
Employee Engagement & HR Strategy Assignment: Case Analysis of Tech Solutions Inc. on Turnover, D&I, Performance, and Work-Life Balance Employee Engagement & HR Strategy Assignment: Case Analysis of Tech Solutions Inc. on Turnover, D&I, Performance, and Work-Life Balance
Read More -
Higher Education Reform Assignment: Curriculum Development Strategies for a Future-Ready Malaysia Higher Education Reform Assignment: Curriculum Development Strategies for a Future-Ready Malaysia
Read More -
Cross-Cultural Management Assignment Report: Importance, Challenges & Strategies in Global Teams Cross-Cultural Management Assignment Report: Importance, Challenges & Strategies in Global Teams
Read More
